Data-driven animations - when content reacts to reality
Spis treści:
What is data-driven animation?
Data-driven animation is a solution where selected elements of a creative piece change automatically based on incoming values. Instead of preparing dozens of separate versions of a file, you can create a single visual system and define the rules for how it operates. When the data changes, the animation changes. This could mean a simple update of a number on a screen, but the possibilities are much greater.
Data can influence, among other things:
- text and numbers
- element proportions
- colors
- object positioning
- the product being presented
- graphics or scenes
- how elements are animated
- the advertising message
- the order of information presented
In more advanced solutions, data can even determine which version of a creative a viewer sees at any given moment. We aren't designing a single video then. We are designing the rules by which the video can change.
Data a company already owns can become part of its communication
Many organizations possess large amounts of data that have previously been used primarily for analysis, reporting, or business decision-making. Some of this can also become creative material. Let's imagine a few simple scenarios.
Sales influence the animation
A brand is running a competition between two products. Instead of manually preparing constant updates on the results, the system pulls sales data and automatically changes the proportions of the animation elements. The viewer sees the current state of the competition in real-time.
Product availability changes the message
If the system has information about the current offer or stock levels, the screen can display products that are actually available at that specific location. You can also change the order of promoted items based on established conditions.
Time of day influences content
The same screen can communicate something different in the morning, at lunchtime, and in the evening. This doesn't just mean swapping one spot for another. The entire creative can be designed as a system that changes elements along with the context.
Weather changes the ad
When the temperature exceeds a certain value, a different product appears on the screen. If it starts to rain, the message, graphics, or the entire animation behavior changes. In the case of a DOOH campaign, such a creative can react to conditions at a specific location.
Results and events become part of the creative
Competition results, voting, participant numbers, reaching a specific goal, or other variables can continuously influence what happens on the screen.
The list of possible applications is very long. The key question is not: "Which data can make brand communication more current, useful, or engaging?"
Animation instead of multiple file versions
One of the greatest advantages of this approach is moving away from thinking about animation solely as a final MP4 file. Let's assume the value displayed on the screen changes dozens of times during a campaign. The classic approach would mean preparing subsequent versions of the material, exporting, uploading, and replacing them. With a data-driven solution, you can prepare a mechanism that reacts to incoming values on its own. The designer is still responsible for the look, information hierarchy, and animation style. However, the production method changes. Instead of designing a "45% to 55% result," we design how the bar should behave for any result from 0% to 100%. It is a seemingly small difference, but it completely changes the way we think about the project.
Żabka's HOT DOG Challenge
We created such a solution for the Żabka brand during the HOT DOG Challenge campaign. In addition to animating the main key visual, our task was to design an animated bar presenting the current competition results.
The voting result was directly linked to product sales. The data changed throughout the campaign, so the classic preparation of subsequent material versions would not have been a good solution. We needed an animation that would react to the result.
Against the backdrop of a looped animation with characters, a bar appeared showing the current vote proportions. First, we designed its look and how it would animate changes. It had to be legible, fit the campaign's key visual, and work with very different results. Next, we translated the design into an HTML5 solution and connected it to sales data. The data updated every 15 minutes, and the animation automatically reflected the latest result. There was no need to create new material for every change. The data controlled what appeared on the screen.
The second challenge was the scale of the campaign. The animation wasn't going to just one screen with one resolution. The HOT DOG Challenge results were presented on menuboards and Digital Signage screens in Żabka stores. Therefore, the bar was designed as a responsive solution. Its layout adapted to different aspect ratios and resolutions while maintaining data legibility, the character of the animation, and consistency with the campaign's key visual. We also had to account for differences between the devices responsible for playing the content. In projects of this type, the creative concept is only part of the task. The solution must also work correctly in the environment where it will ultimately be used.
Full case study of the Żabka Hot Dog Challenge project →
From Digital Signage to DOOH campaigns
We then expanded the system originally prepared for in-store screens to support a DOOH campaign. We adapted the animation and HTML5 code to meet the requirements of individual media providers. As a result, updated competition results could be tracked not only in Żabka stores but also on outdoor advertising screens across Poland. We created a communication strategy where sales data directly influenced what the viewer saw on the screen. This perfectly illustrates the potential of data-driven animation.
Where can data-driven animations be used?
The mechanism is not tied to a single medium.
Digital Signage
Retail chains, restaurants, and service points are increasingly equipped with digital screens. Dynamic content can react to sales, offers, location, time of day, promotions, or other data specific to a particular location. As a result, the screen ceases to be just a digital poster. It can become a dynamic element of a brand's communication system.
Digital Menu Board
A menu board is a particularly interesting application because it naturally presents information that is subject to change. Price, offers, product availability, promotions, or time of day can be linked to animation to automatically influence the displayed content.
DOOH
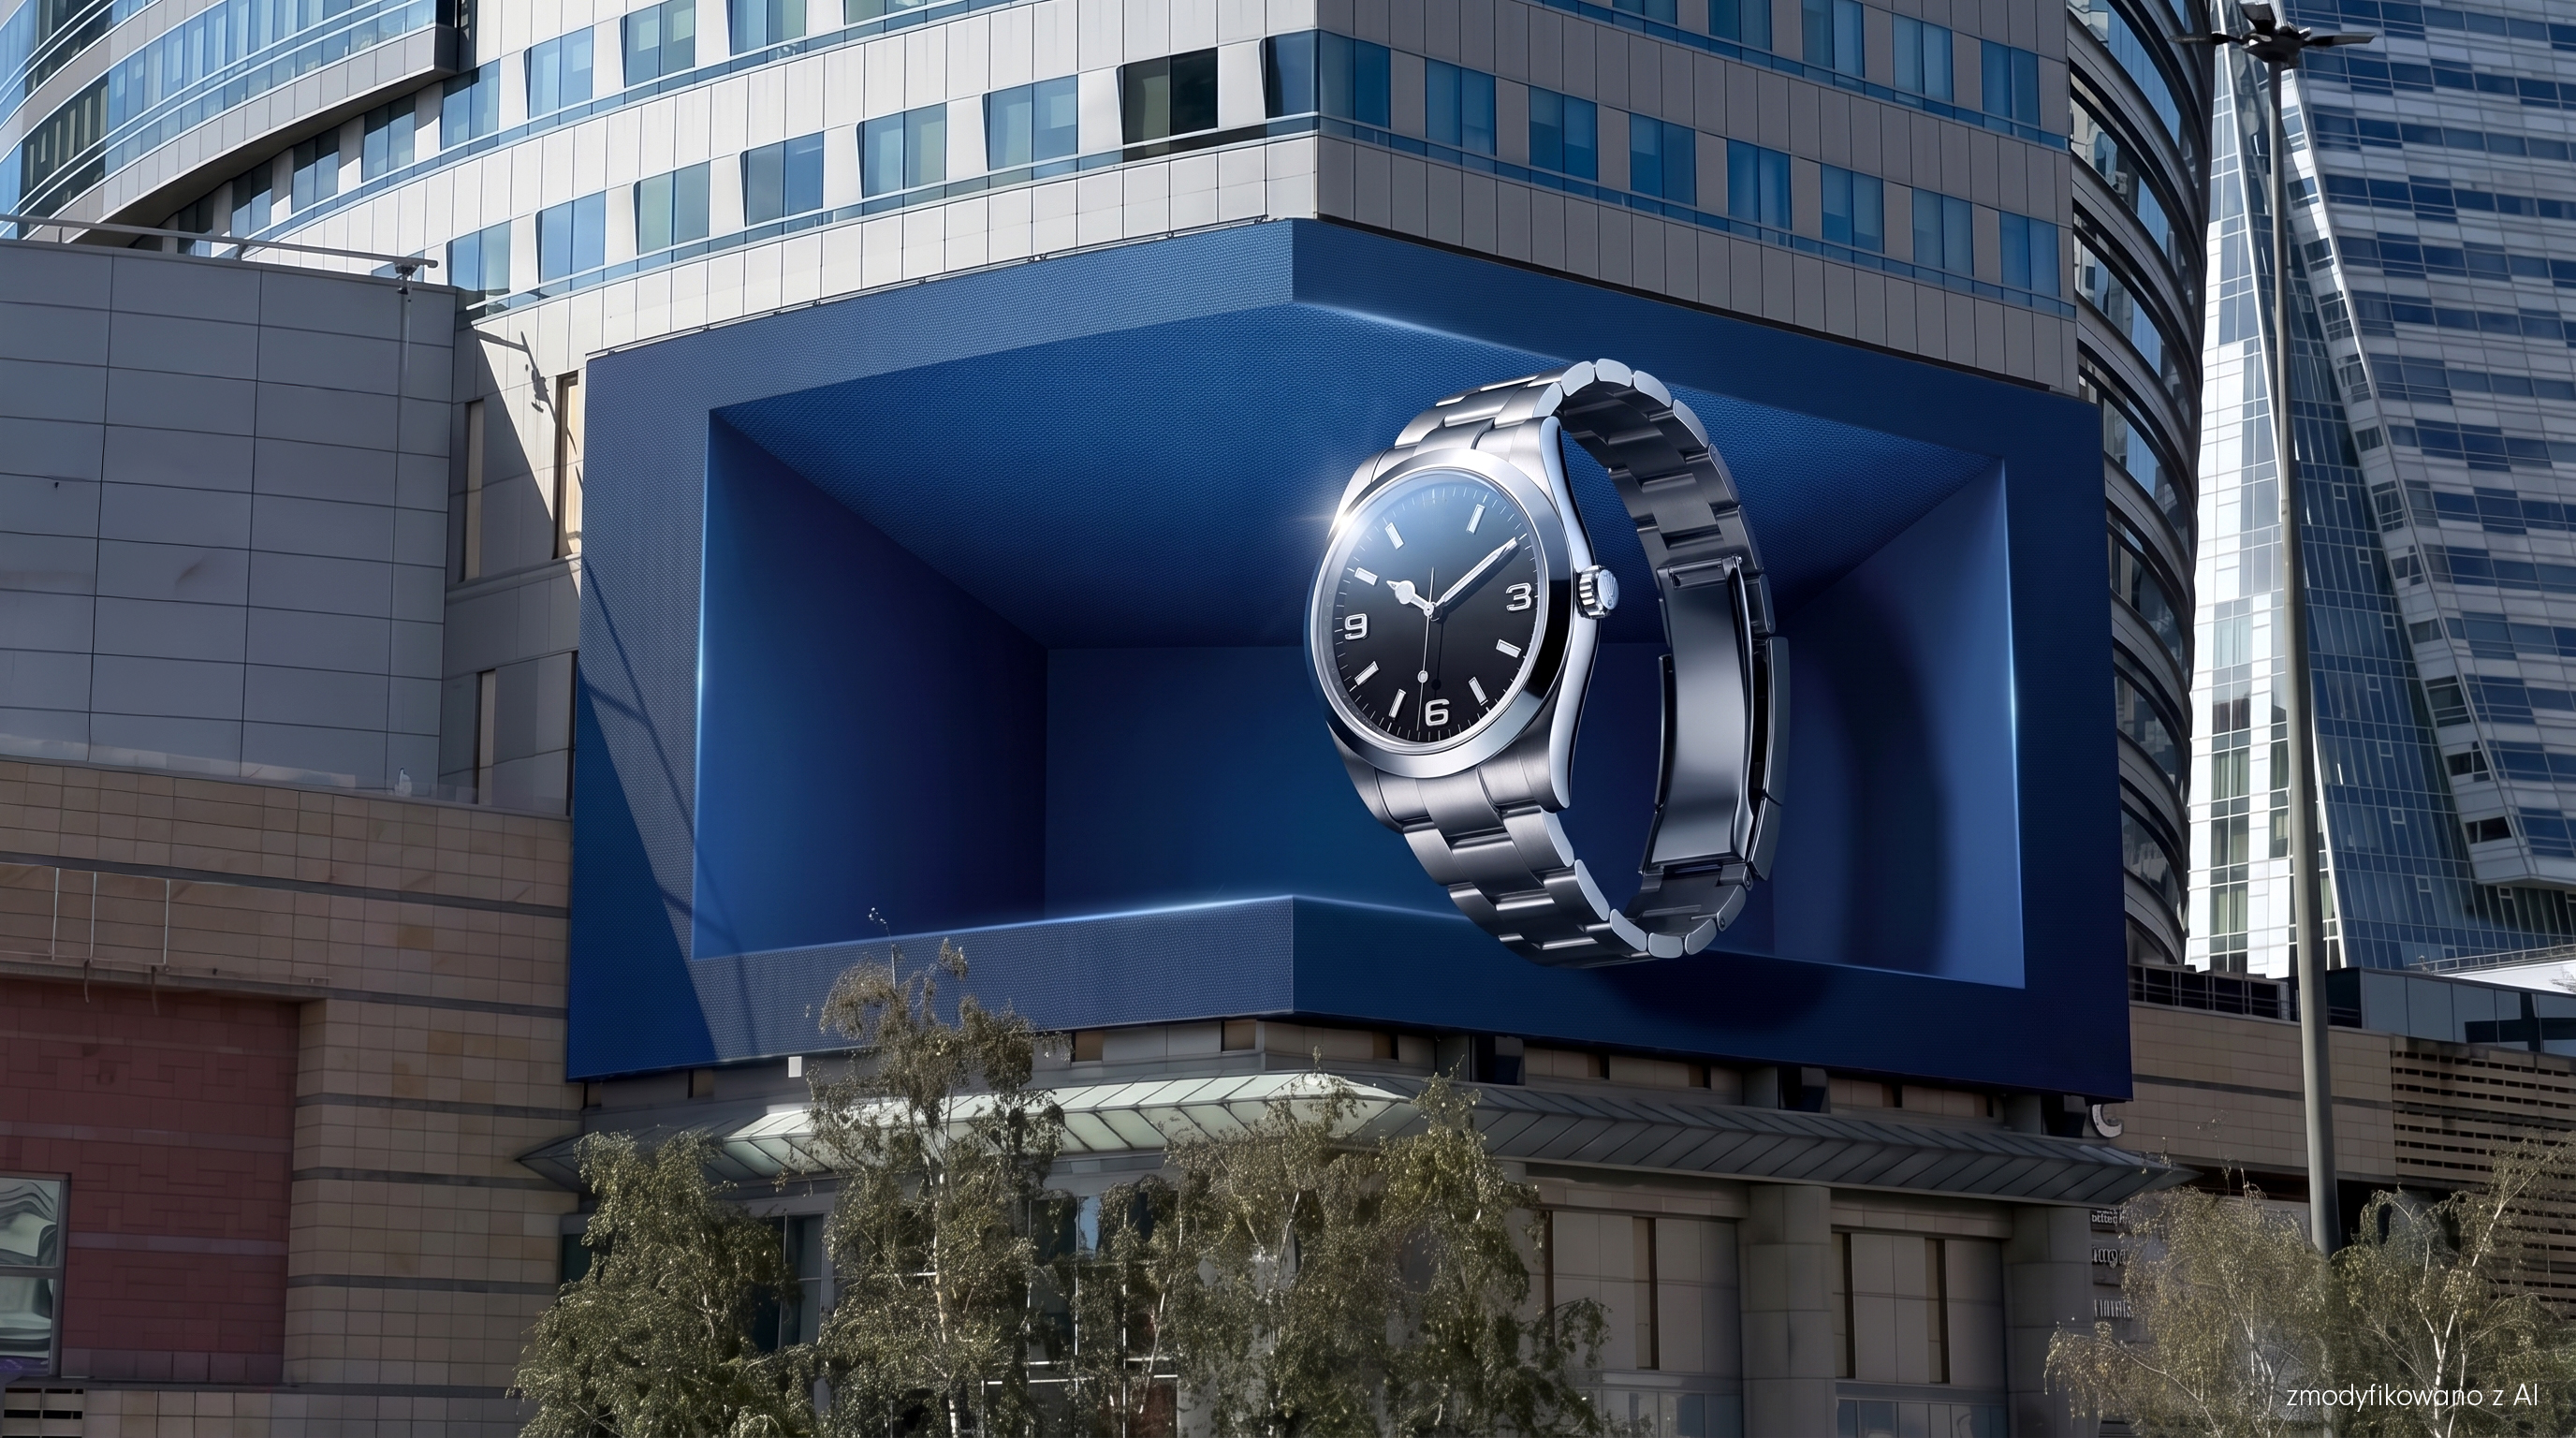
Digital out-of-home advertising offers the opportunity to create context-aware campaigns. Creative assets can change based on weather, time of day, location, event results, or data belonging to the brand itself. In the industry, such solutions are also known as data-driven DOOH, dynamic DOOH, or dynamic creative.
Websites
Data does not have to be used only on large screens. Website elements can react to values pulled from an API, user activity, company performance, or other information updated in real-time. Instead of a classic chart, you can create an experience where data is part of an animated narrative.
Events
Event animations can also react to data collected during an event. The number of participants, voting results, goal progress, or data gathered during the event can be visualized live and become part of the event's production.
Data should not be an effect for the sake of an effect
Technically, you can connect animation to many data sources. However, that does not mean you always should. The most interesting projects are created when data has real significance for the message. If temperature affects the need for a product, then weather data makes sense. If sales determine the outcome of a competition, then sales data makes sense. If offer availability varies by location, then product data makes sense. Simply showing a current number just because we can pull it from an API will not automatically make the communication better. You need an idea first. Only then comes the technology.
How is data-driven animation created?
The process differs from classic animation production.
1. We start with the data
We need to know what information is available, how often it changes, and how it can be retrieved. It is equally important to define the possible values and edge cases.
2. Defining the rules
Next, we define which animation elements the data should influence. What changes when a value increases? What happens when a specific threshold is crossed? Are we changing just a number, or the entire message? This is where we turn data into creative logic.
3. Designing the visual system
The design must account for all possible variations. We don't just create one perfect frame; we build a system that should look good regardless of the values it receives.
4. Combining design with technology
Depending on the application, this may involve using HTML5, JavaScript, APIs, or other technologies that connect data to the visual layer. However, technology is just a tool. Its purpose is to translate the designed animation behavior into a functional mechanism as accurately as possible.
5. Adapting the solution to the environment
A website, an app, a Digital Signage screen, and DOOH media can have completely different technical requirements. That is why it is worth knowing where the solution will run from the very beginning. The larger the scale and the number of environments, the more important compatibility, responsiveness, and data delivery methods become.
The future of content doesn't have to mean more animations
It can mean smarter animations. Instead of producing multiple versions of the same communication, a brand can create a single system that adapts to changing conditions. Data that previously went primarily into dashboards and reports can start influencing the communication seen by customers. Sales can change an animation. Weather can change an ad. Location can change a message. Offers can change a menu board. Results can change the entire image on a screen. The possibilities are vast, but one thing remains most important: data should serve the idea, not replace it. When you successfully combine valuable data, motion design and technology, animation ceases to be a static asset. It begins to react to reality.